Charts you can trust to the decimal.
TREDIA Canvas is our own charting engine: fast, clean and verified against Pine Script — on stocks, ETFs, crypto, currencies and commodities.
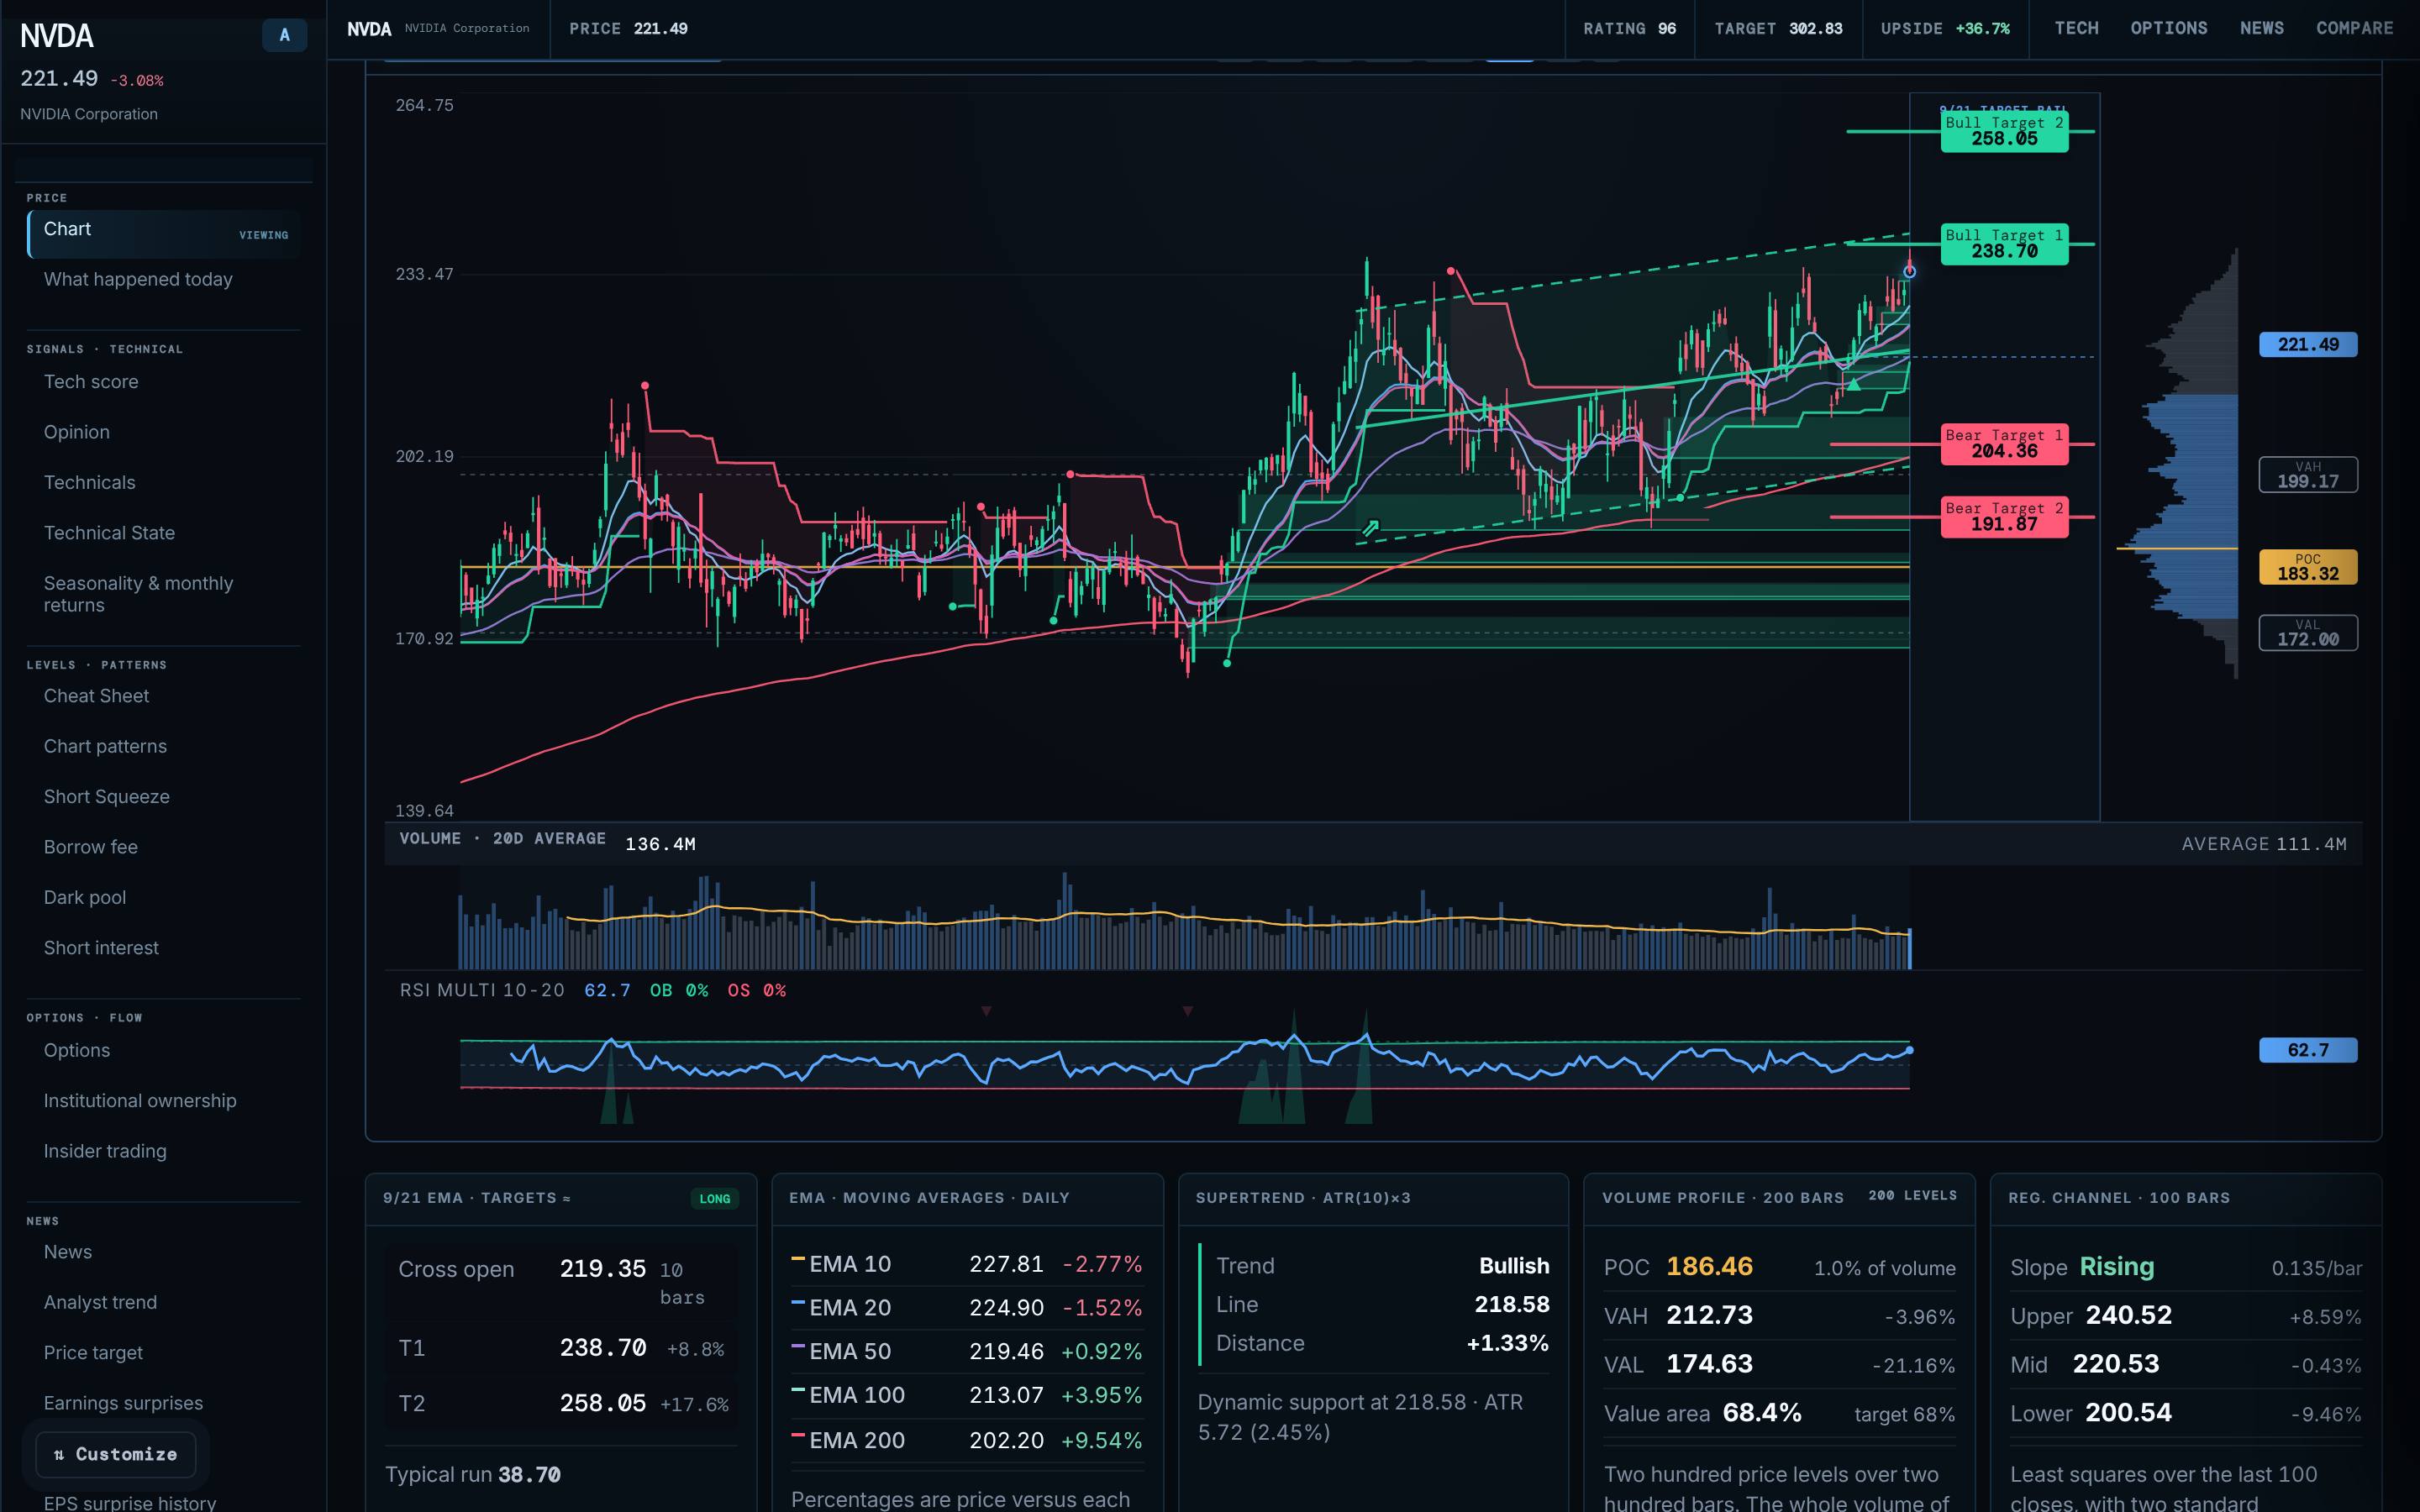
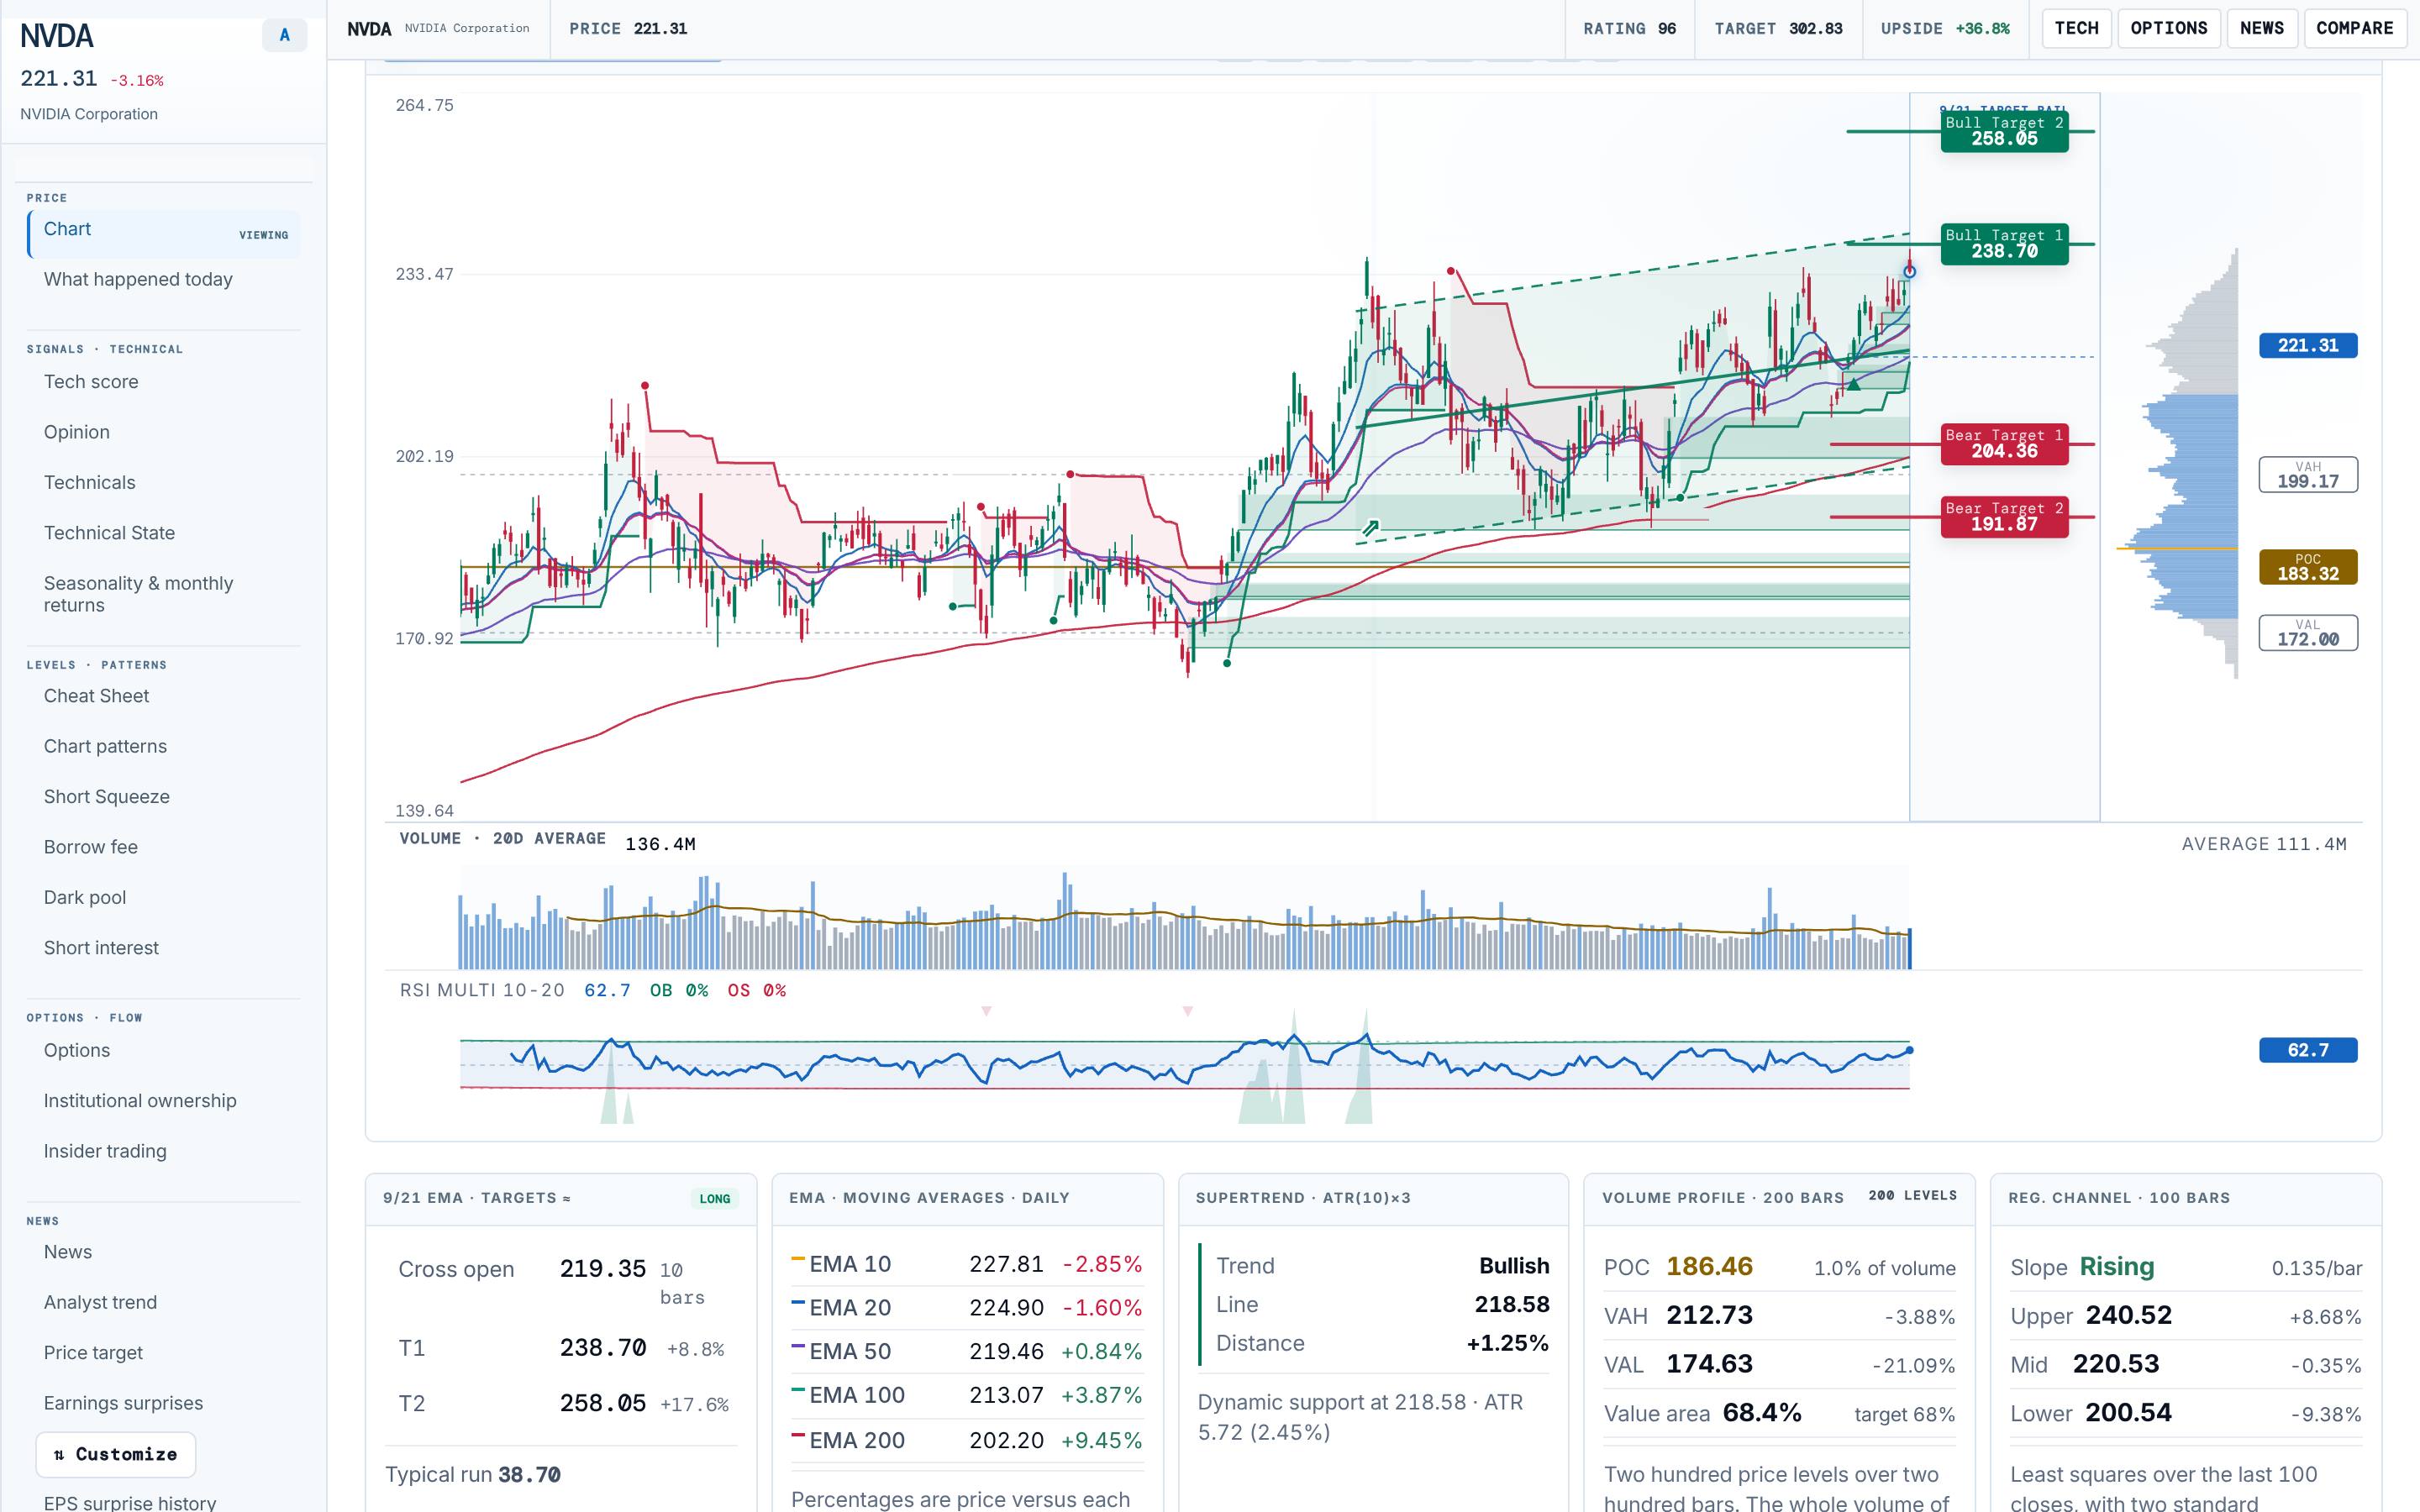
A charting engine built in‑house — matched to Pine.
TREDIA Canvas
A native chart for every instrument, from 4-hour candles to multi-year views, with clean defaults and moving averages in EMA or SMA mode.
Indicators
RSI, MACD, Stochastic, ATR, OBV, Bollinger Bands, VWAP 20, Donchian 20, SuperTrend 10/3, ADX/DMI and MCDX, plus a projection cone, next-day range and ATR stop.
Presets
Clean, Trend, Structure and Momentum: four curated layouts so you stop rebuilding the same chart.
EMA 9/21 targets
Targets computed exactly like the Pine reference — 0.00% deviation on NVDA, AAPL, SPY, TSLA and BTC on 4-hour bars.
Corporate actions handled
When a split or spin-off breaks comparability, the chart marks it and the affected fields switch off instead of showing wrong numbers.
Instrument page
Chart, TREDIA Score, valuation, earnings surprises, ownership, a fair-value model with your own thesis, and “what happened today” — on one page.
Verified against the reference
We test our indicator math against Pine Script on real instruments and publish the result. On the latest release, EMA 9/21 targets on 4-hour bars matched the Pine reference with 0.00% deviation on NVDA, AAPL, SPY, TSLA and BTC.
Status: Available in the beta
Precision charts
Which timeframes are available?
From 4-hour candles to multi-year history.
Can I chart currencies and commodities?
Yes. The same engine and indicators work across asset classes.
See the whole market. In one place.
Join the private beta and get your invitation as new seats open.