Find the setups worth your time.
Screen 3,194 stocks and 2,110 ETFs, rank them with a transparent score, and test whether a pattern has actually worked before you trust it.
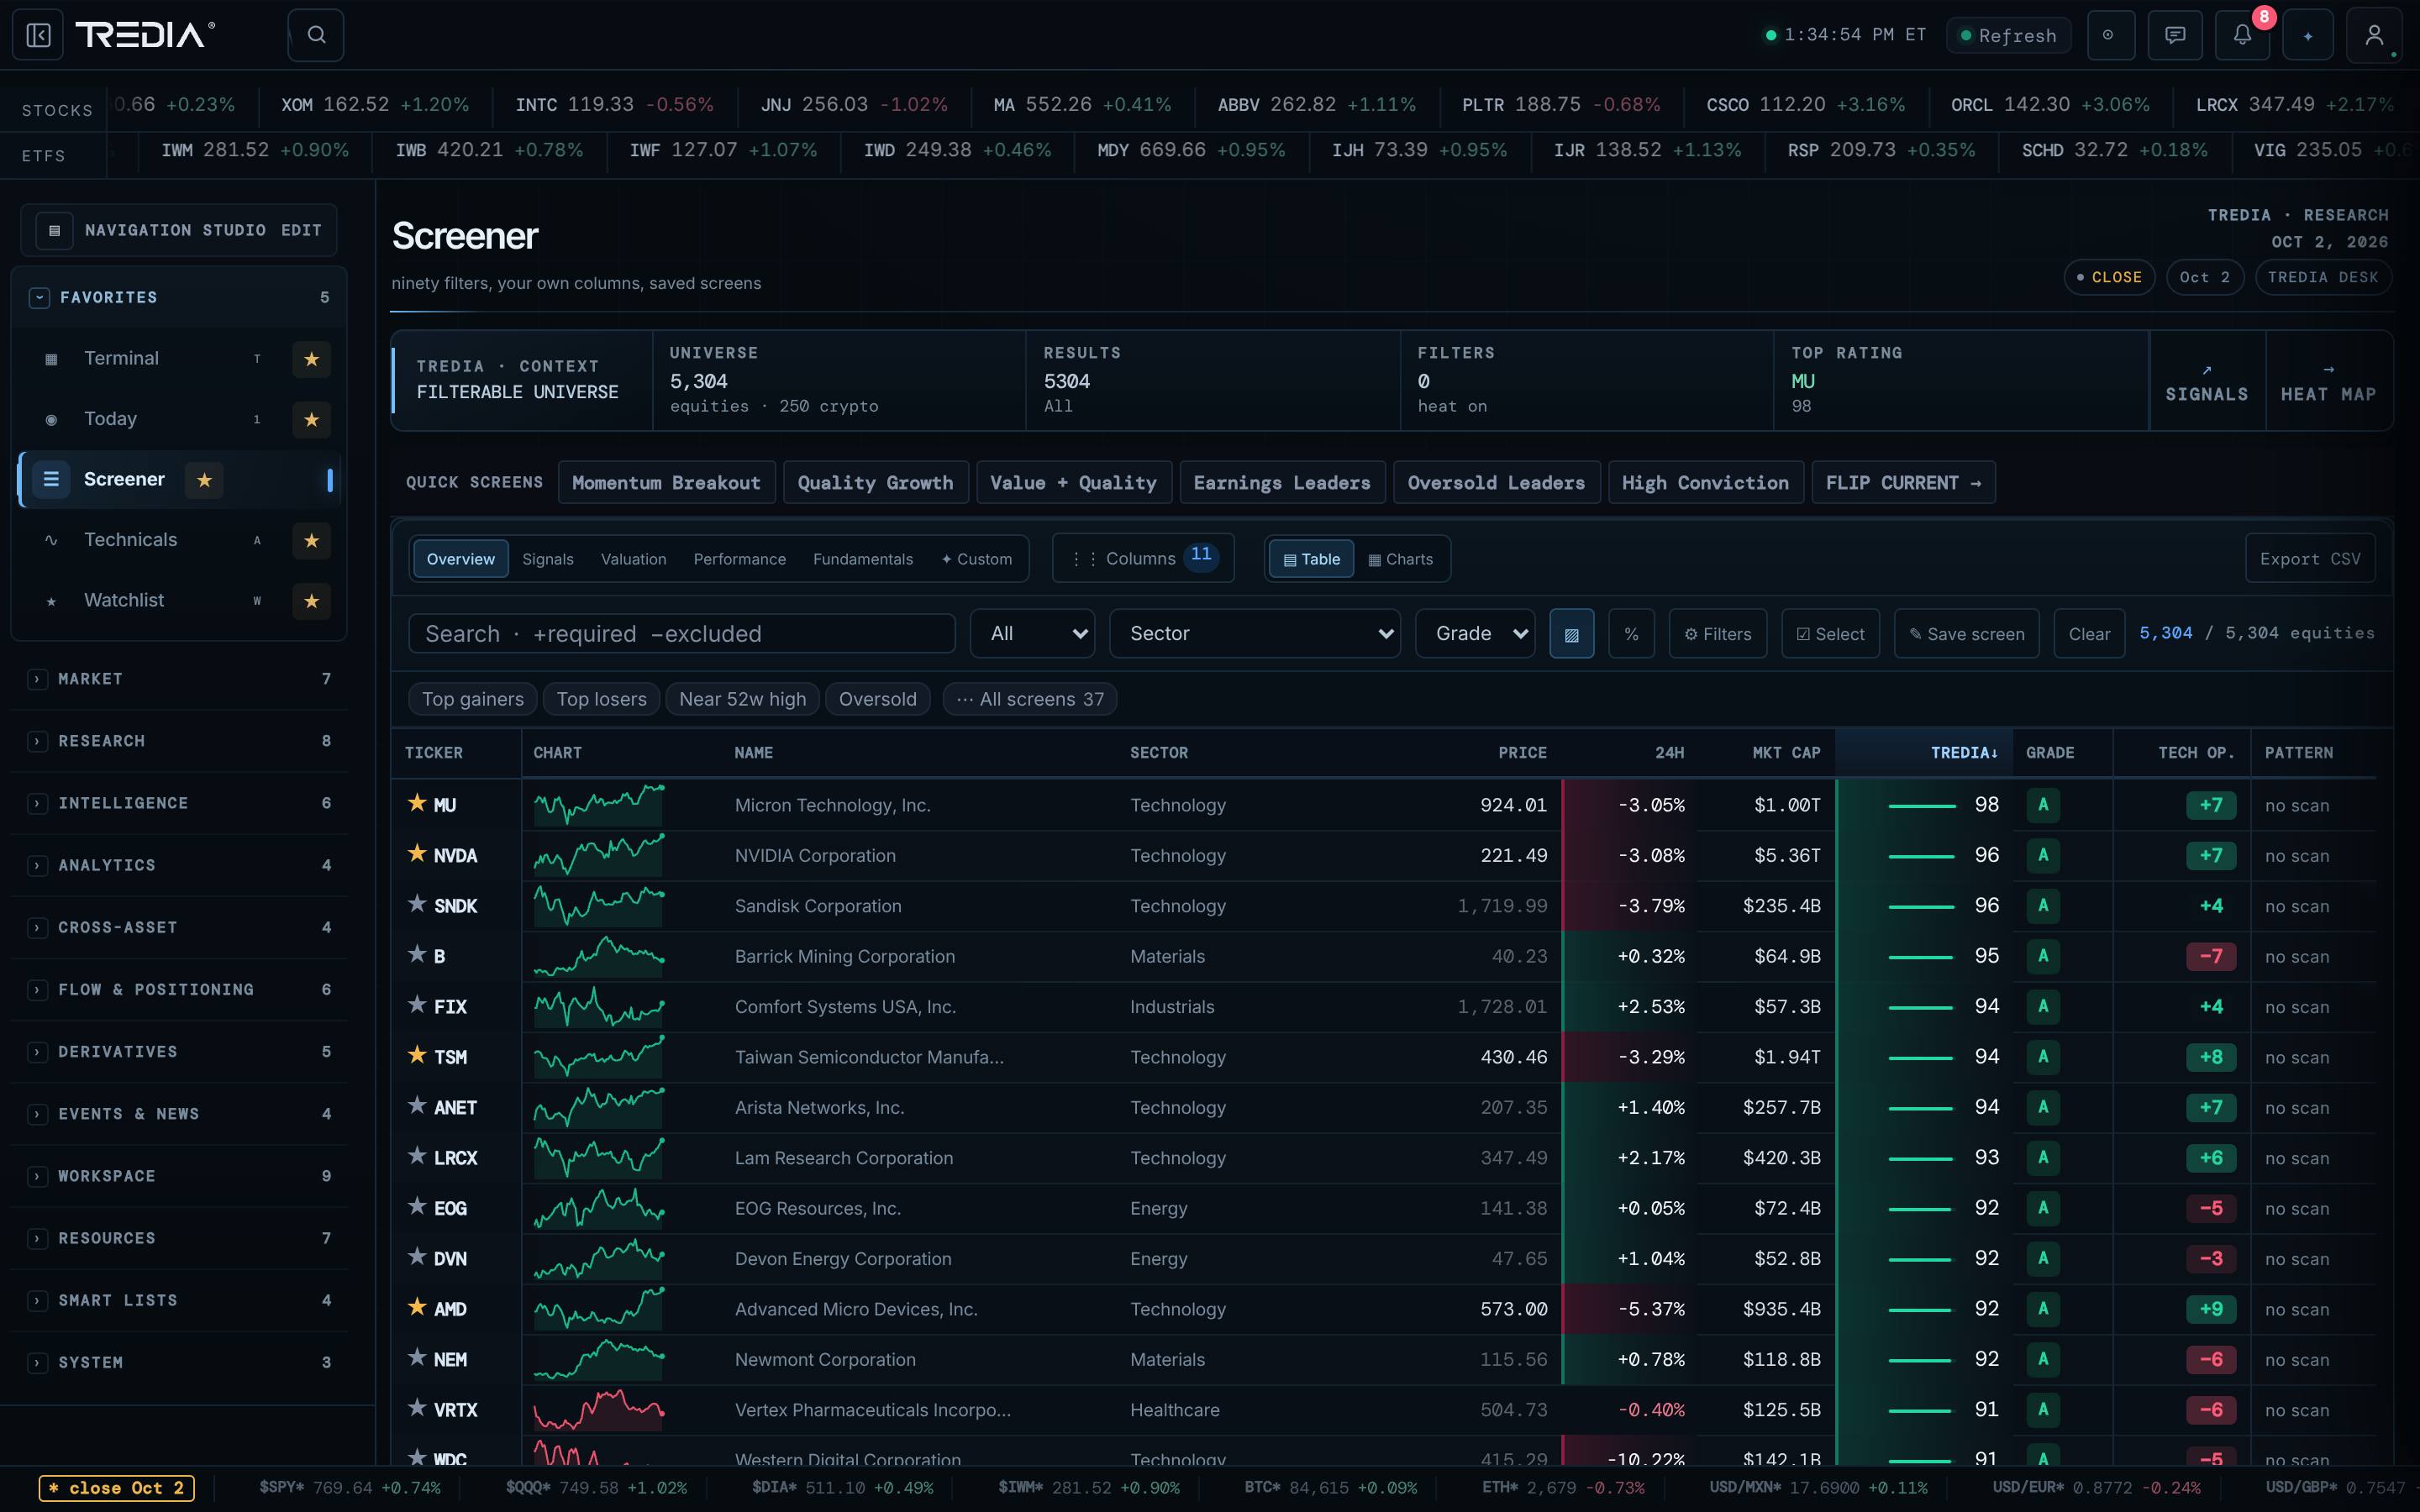
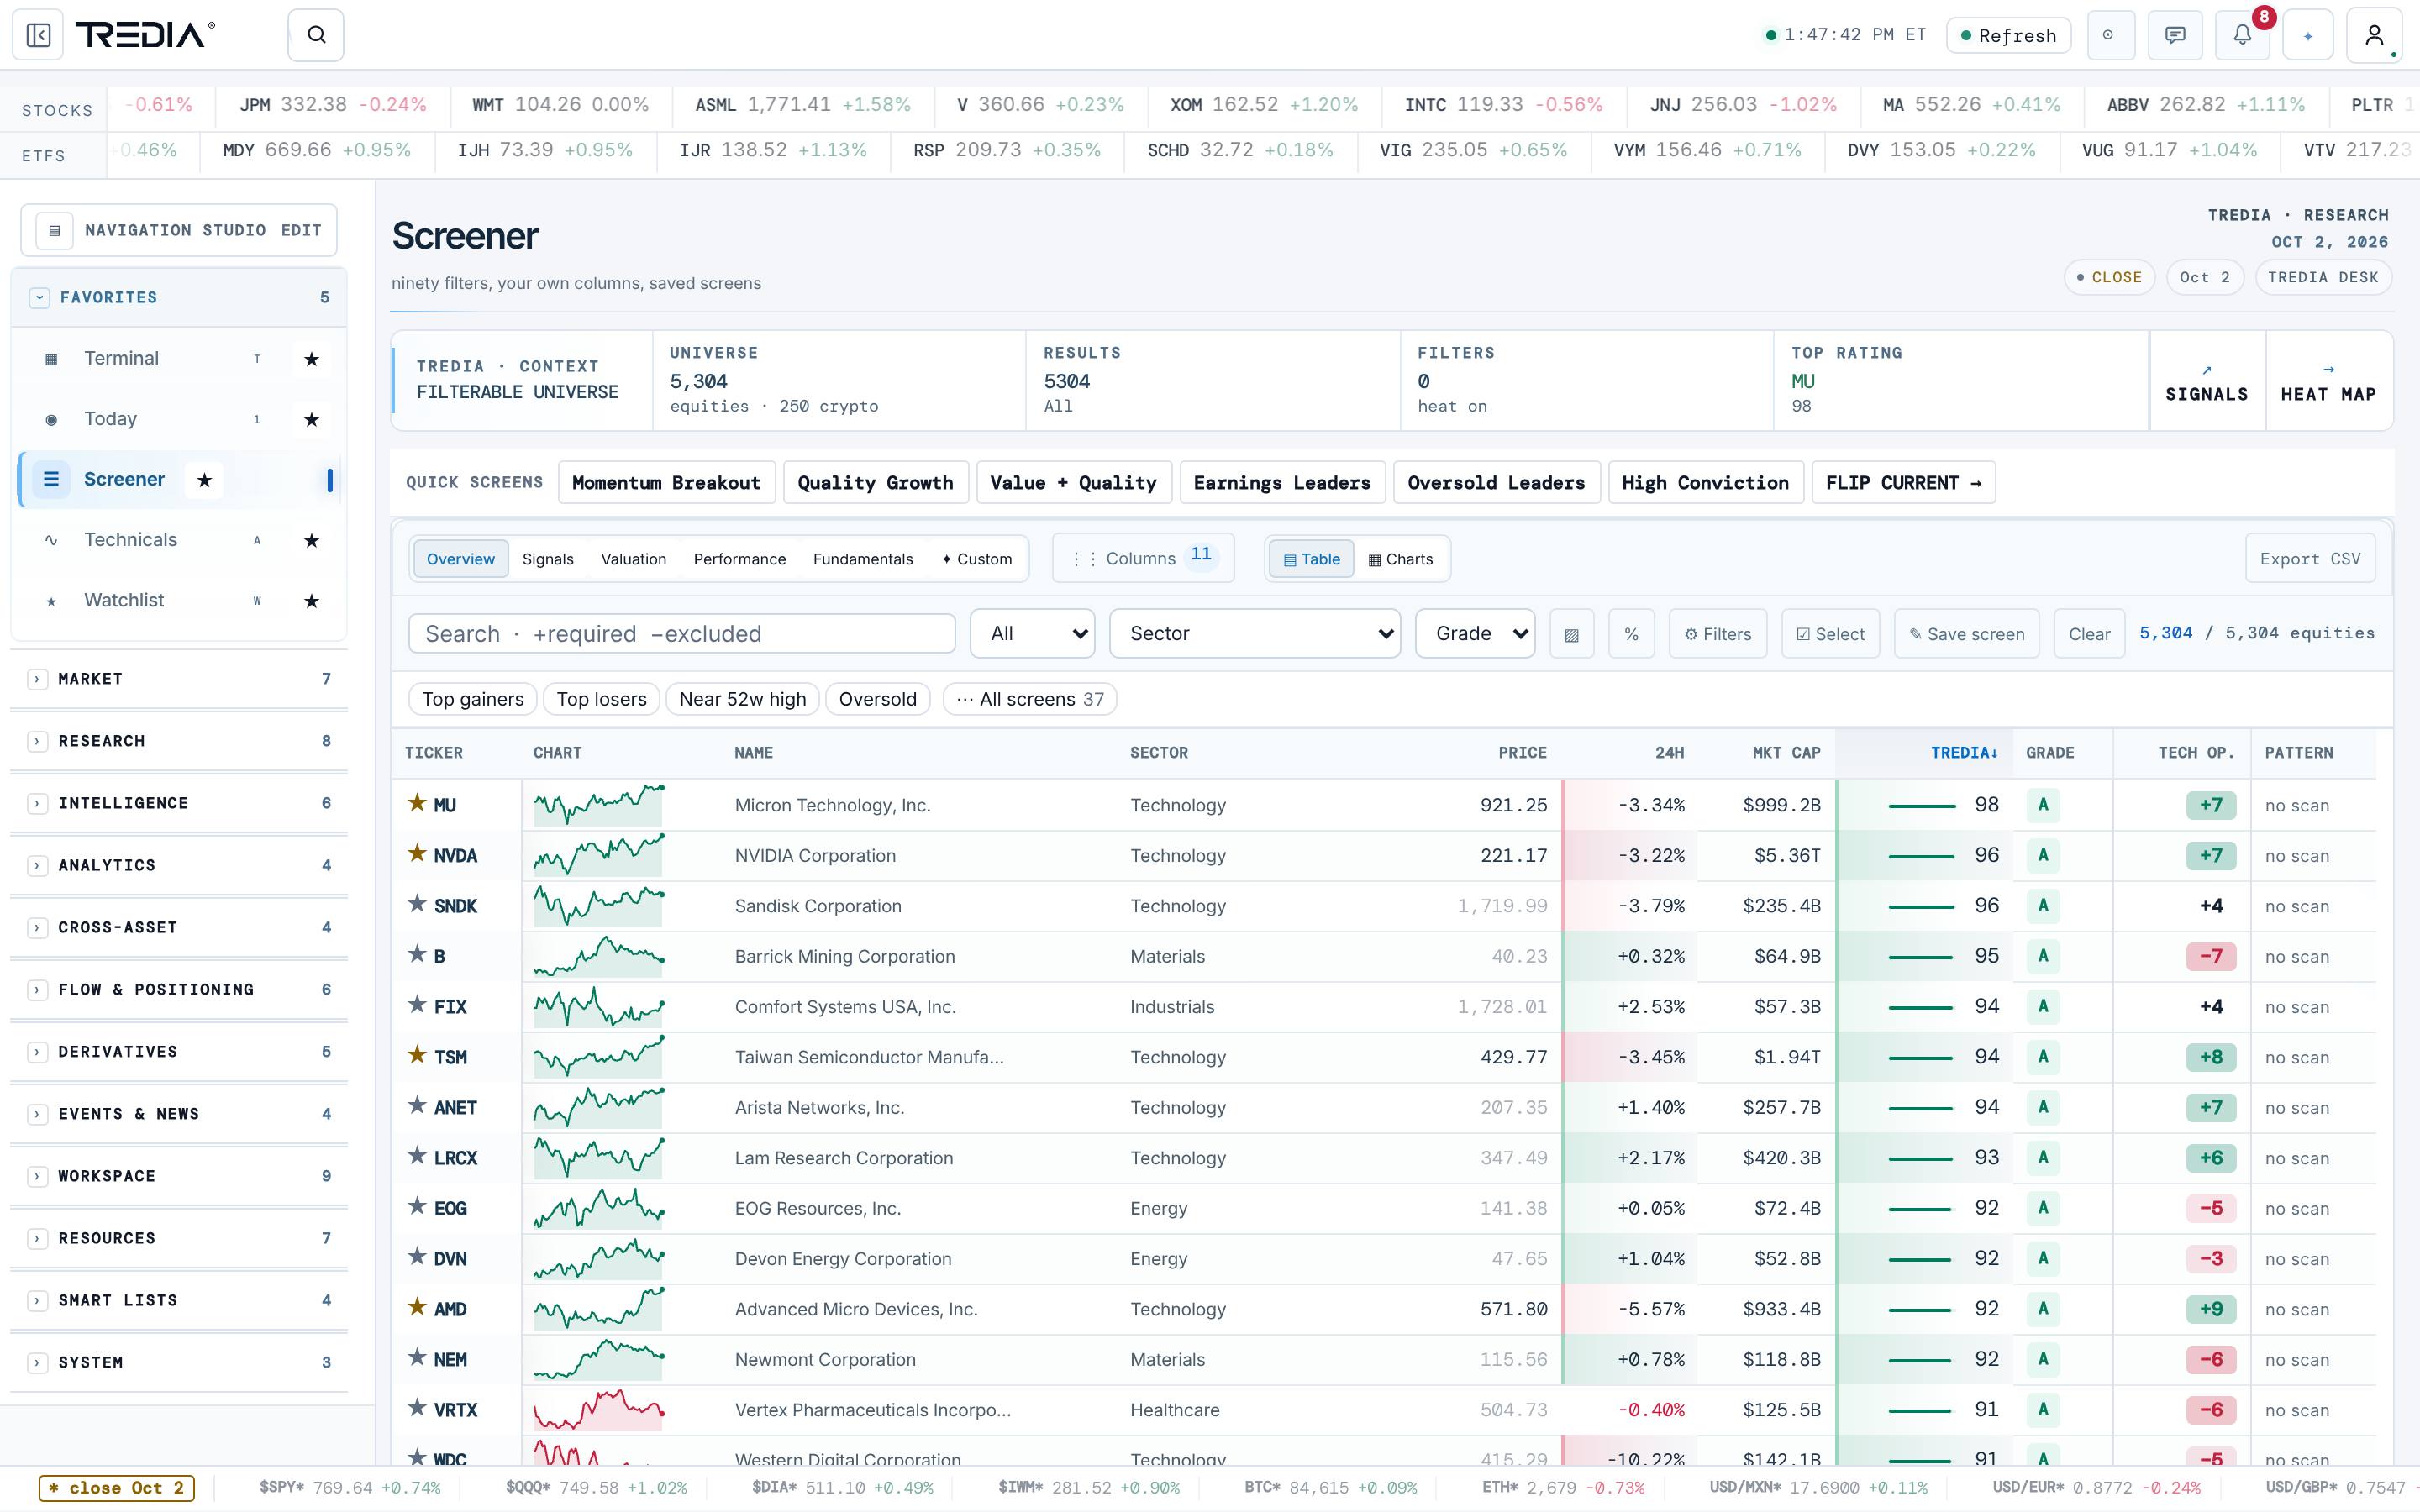
5,304 stocks and ETFs. One fast screener.
Screener
Descriptive, fundamental and technical filters over the whole universe, column views you can switch, and CSV export.
TREDIA Score & Ranking
A 0–15 score and a relative ranking for every name, next to the valuation, technical and business sections that explain it.
Technical Opinion
A −10 to +10 composite per instrument with its component breakdown and historical hit rate — a screener column, not a recommendation.
Chart patterns
Automatic detection of trendlines, channels, triangles, wedges, double tops and bottoms, head-and-shoulders and flags — each with a measured target, an invalidation level and its historical success rate with the sample size.
Seasonality
A monthly-returns grid computed from the instrument’s own history.
Earnings Implied Move Beta
The move the market expects around earnings, next to how the stock actually reacted in past reports.
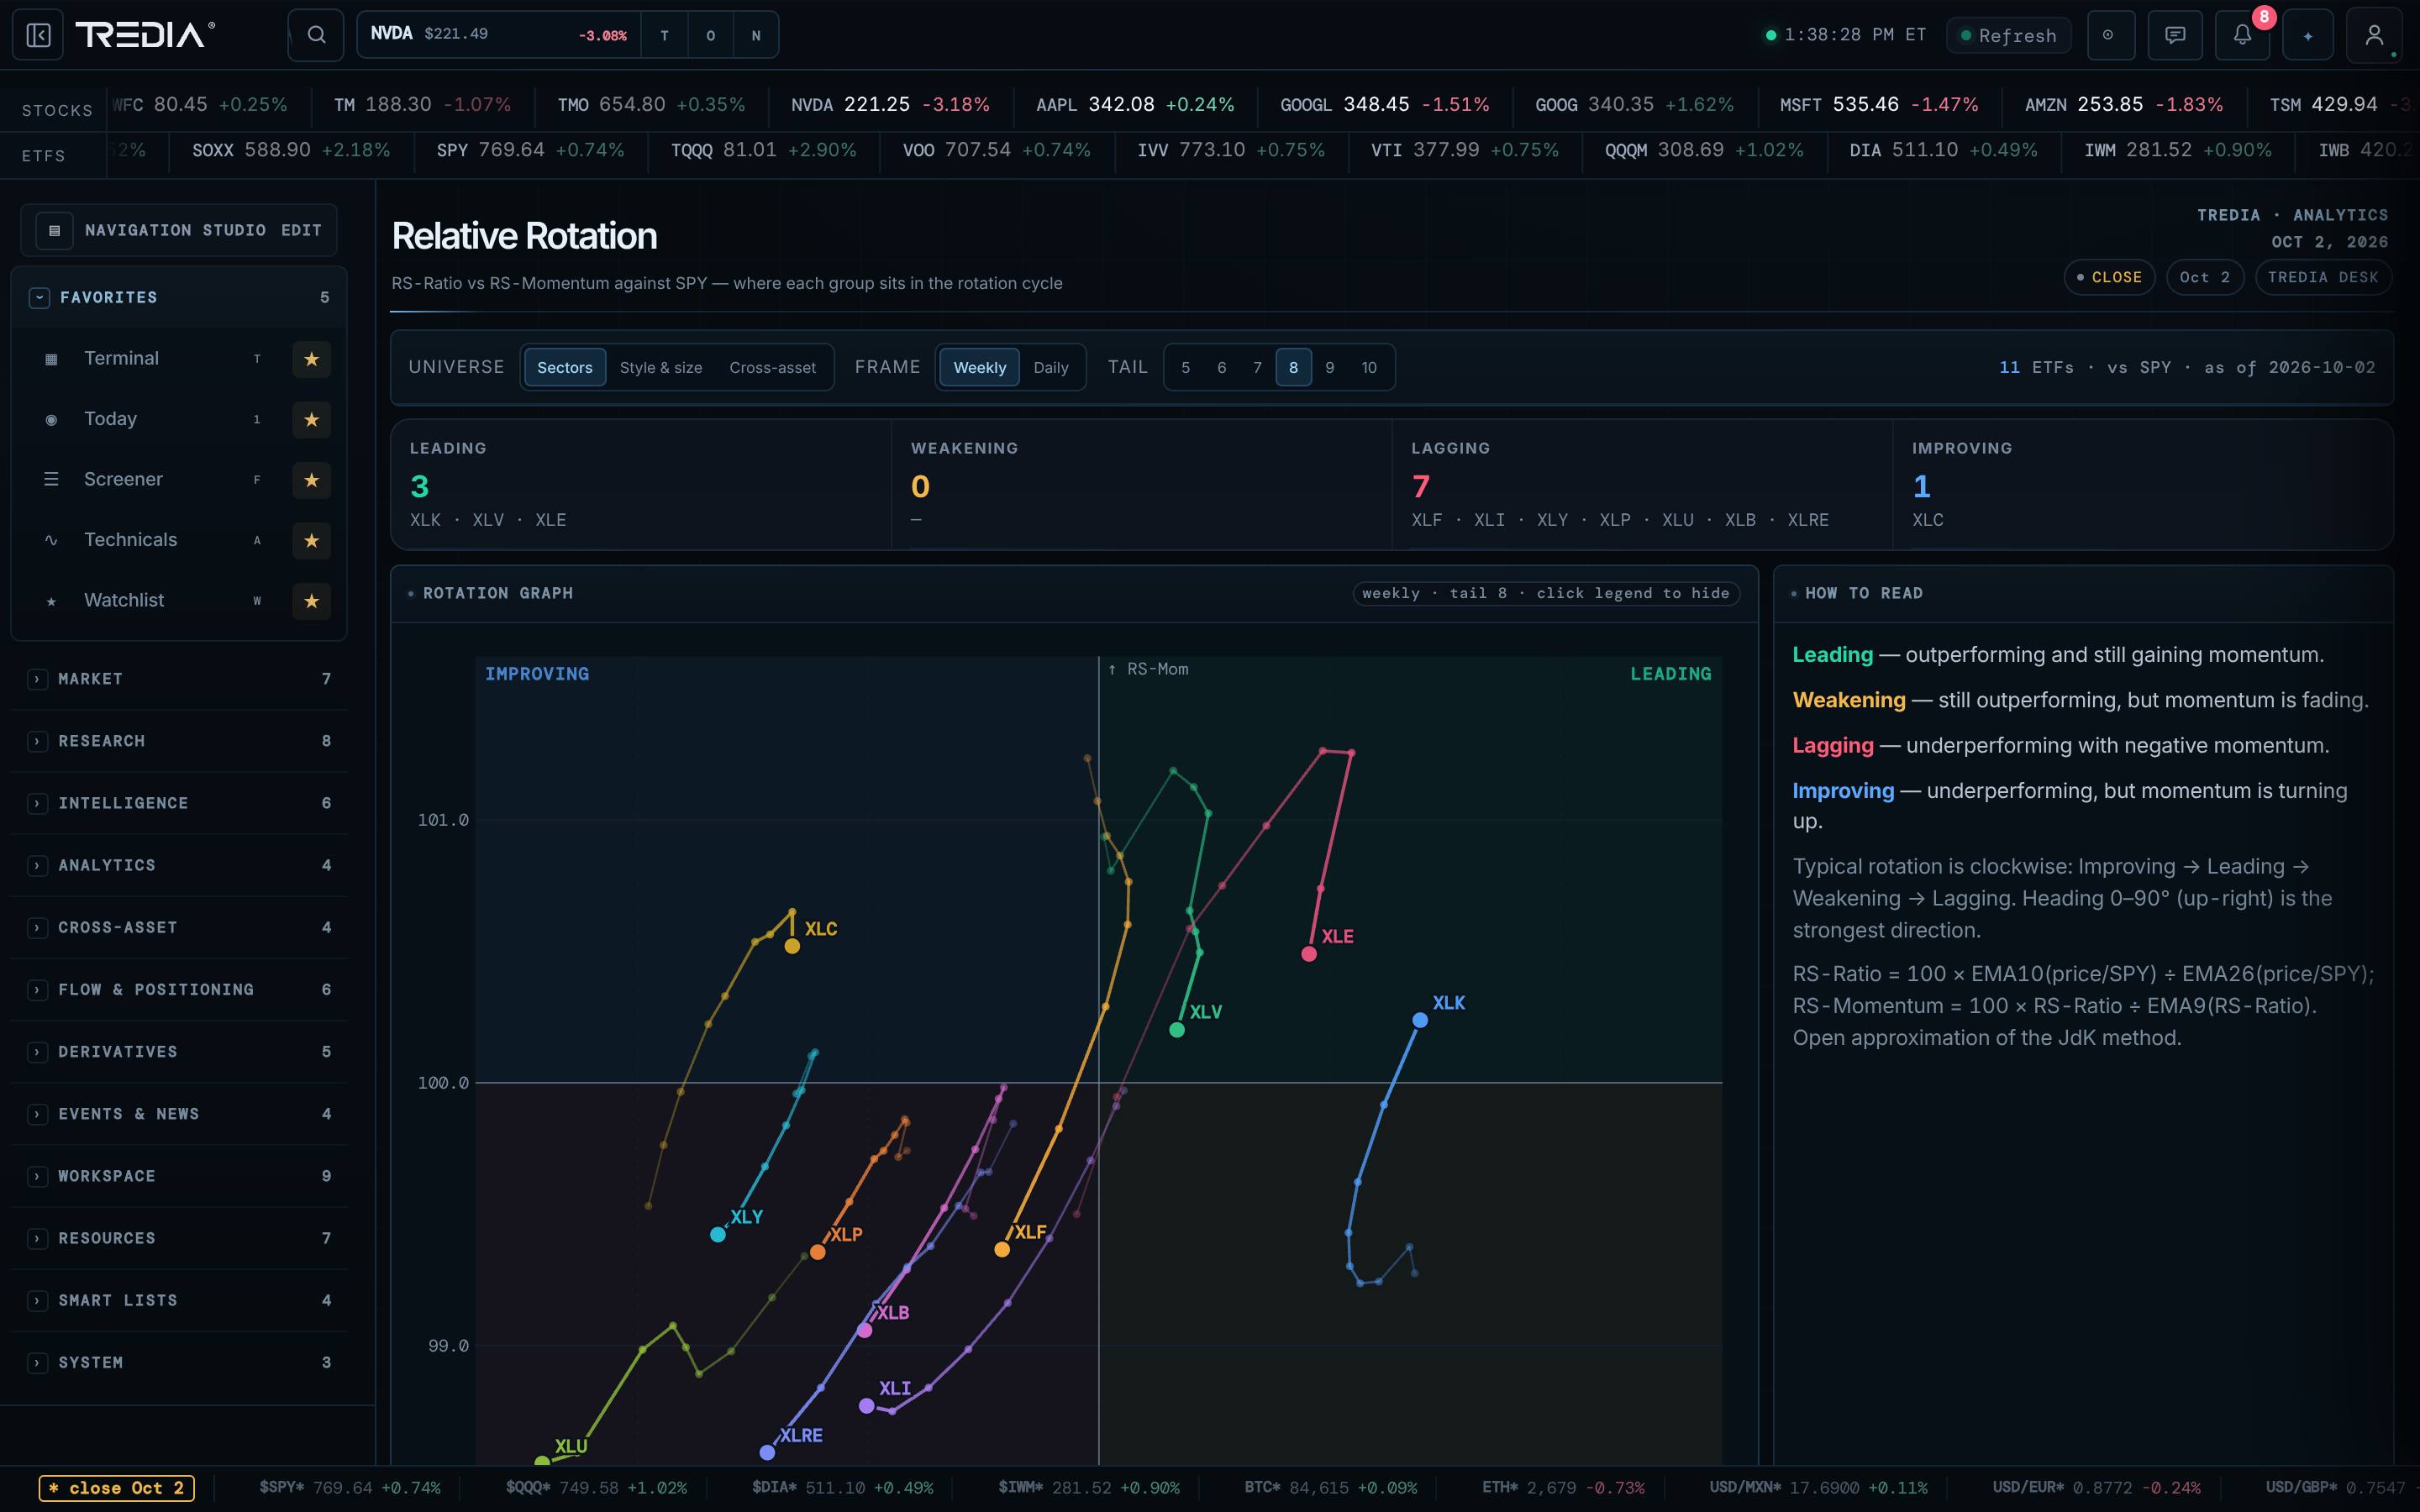
Scores you can audit
Scores in TREDIA are rule-based and shown with their parts: Technical Opinion lists each component and its historical hit rate, and every detected chart pattern carries its success rate and sample size, measured walk-forward on TREDIA’s own universe. One formula per indicator, used everywhere.
Scores, rankings and composite readings are analytical indicators. They are not recommendations to buy or sell any security.
Status: Available in the beta
Screen & rank
Can I export results?
Yes — screener results export to CSV.
Are scores investment advice?
No. They are technical indicators computed from price and volume. How you use them is your decision.
See the whole market. In one place.
Join the private beta and get your invitation as new seats open.